What a Fish Population Survey Measures
Have you ever wondered why your favorite fishing spot seems to have incredible numbers of walleye one year, and then the next, it feels like they've all vanished? Or why the size limits for crappie might be different on one lake compared to another just down the road? It can be incredibly frustrating when you're out on the water, putting in the time, and things aren't adding up. This guide is here to pull back the curtain on one of the most vital tools in fisheries management: the fish population survey, explaining exactly what these critical assessments measure and why they matter to every angler in South Dakota.
The Core Purpose of a Fish Population Survey: Beyond Just Catching Fish
When the South Dakota Game, Fish and Parks (GFP) conducts a fish population survey, they're not just counting how many fish are in a lake. That's a common misconception, and frankly, it's far too simplistic for the complex ecosystems we enjoy. These surveys are meticulous scientific endeavors designed to paint a comprehensive picture of what's happening beneath the surface, driving decisions that affect our fishing opportunities for years to come.
Understanding the Health of the Ecosystem
Think of a lake or a stretch of river as a patient. A fish population survey is like a full diagnostic check-up, much more involved than simply taking a fish's pulse. Biologists are looking at the overall health of the aquatic environment, not just the number of fish. This includes everything from water quality, available forage (the food fish eat), and the condition of the habitat itself. If a lake's habitat is degrading, say from excessive sediment runoff or loss of aquatic vegetation, it directly impacts the fish population, even if current catch rates are still decent. Surveys help identify these underlying issues before they become major problems, providing crucial insights into what factors might be stressing the fish. It's a proactive approach to ensure that future generations can also enjoy the incredible fishing South Dakota has to offer.
These surveys also play a monumental role in conservation and long-term sustainability. Without accurate data, managing a fishery becomes a guessing game, and we all know how that usually ends – with depleted stocks and disappointed anglers. By regularly assessing populations, the GFP can monitor trends, such as declining numbers of South Dakota Chinook salmon in Lake Oahe or shifts in the dominant species in a glacial lake. They can then identify potential threats, whether it's an invasive species like zebra mussels competing for resources, or environmental changes that affect spawning success. It’s all about maintaining a delicate balance, allowing us to harvest fish while ensuring that the populations remain robust and self-sustaining.
Data-Driven Management Decisions
The information gathered from these surveys is the backbone of all fisheries management decisions in South Dakota. Every regulation, every stocking plan, every habitat improvement project is ideally rooted in the data collected. For instance, if a survey reveals that walleye in Lake Sharpe are abundant but growing slowly, it might suggest there's too much competition for food, or perhaps a different size regulation is needed to allow smaller fish to mature. Conversely, if a specific year class of smallmouth bass is missing or weak in Lake Francis Case, it could trigger investigations into what went wrong during that spawning season and inform future stocking efforts or habitat enhancements.
These decisions are critical for avoiding overfishing, a problem that has plagued fisheries globally. By understanding the population dynamics – birth rates, death rates, growth rates – biologists can recommend appropriate harvest limits and season lengths that allow anglers to enjoy their sport without jeopardizing the future of the fishery. It’s a constant balancing act between angler demand and biological sustainability. Imagine a scenario where a lake's walleye population is experiencing a few years of poor natural reproduction due to unusual weather patterns. Without a survey, anglers might continue harvesting at previous rates, inadvertently pushing the population into a serious decline. The survey acts as an early warning system, allowing managers to adjust South Dakota Walleye Limits or implement temporary restrictions to protect the struggling year classes, giving them a chance to recover.
Key Metrics and What They Tell Us
So, when the biologists pull in their nets or run their electrofishing boats, what exactly are they measuring? It's a lot more than just a head count. They're gathering a suite of detailed information that provides a deep dive into the specifics of the fish community.
Species Composition and Abundance
One of the most fundamental measurements is simply understanding what fish species are present in a body of water and how many of each there are. Is it primarily a walleye fishery, or are northern pike and perch dominating the landscape? This gives a broad overview of the ecosystem. For example, a survey might confirm a healthy mix of game fish like South Dakota smallmouth bass and panfish like crappie, alongside forage species like cisco or smelt. A shift in species composition, such as a sudden explosion of common carp or the appearance of an unwanted invasive species, can signal significant ecological changes.
The abundance of each species tells managers about the overall population size. However, it's not always about sheer numbers. A lake might have a huge number of walleye, but if they're all small and stunted, that's not necessarily a healthy or desirable fishery. This metric is often expressed as Catch Per Unit Effort (CPUE), meaning how many fish were caught per hour of electrofishing or per net-night. Higher CPUE generally indicates a more abundant population. Knowing the dominant species and their relative numbers helps biologists understand the food web structure and identify potential bottlenecks, such as a lack of suitable prey for a large predator population. For example, if walleye are incredibly numerous but their primary food source, yellow perch, are scarce, it could indicate a problem with the perch population or suggest that the walleye themselves are overpopulated for the available food.
Fish Size and Age Distribution
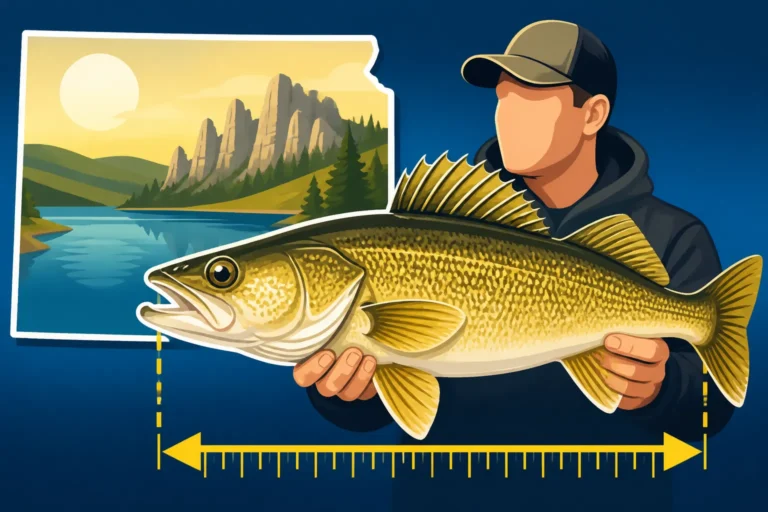
This is where things get really interesting for anglers hoping to land a trophy fish. Biologists meticulously measure the length and weight of captured fish, creating length-frequency distributions. This data helps them determine if the population has a good balance of different sizes – small, medium, and large fish. If a lake shows a lot of small fish but very few large ones, it might indicate high angler harvest pressure on bigger fish, or perhaps a problem with older fish survival. Conversely, a population with a strong presence of large, mature fish suggests excellent growth conditions and effective management, potentially warranting a South Dakota Trophy Fish Award Program mention for anglers.
Age analysis is even more revealing. By examining otoliths (ear bones) or scales, biologists can determine the age of individual fish. This allows them to calculate growth rates – how quickly fish are growing in a particular lake. If fish are growing slowly, it could point to a lack of food, poor water quality, or simply too many fish for the available resources. This data is vital for setting regulations like slot limits, which aim to protect certain size classes of fish to ensure they reach maturity and spawn multiple times. For example, if a survey shows a strong year class of 12-inch walleye, managers might implement a slot limit that protects them until they reach 18-20 inches, allowing them to contribute significantly to future spawns. This ensures a sustainable, healthy population and hopefully, more opportunities for anglers to catch those desirable larger fish.
Reproductive Success and Recruitment
A healthy fish population isn't just about the adults currently swimming around; it's about the future. Surveys specifically look for evidence of successful reproduction, often called "recruitment." This means finding young-of-year fish – those that hatched in the current year – or strong numbers of one- and two-year-old fish. The presence of numerous tiny fry or juvenile fish indicates that spawning was successful and that enough young fish survived their most vulnerable stage to join the general population.
Conversely, a lack of strong year classes can be a red flag. If biologists aren't seeing good numbers of young fish over several consecutive years, it might indicate issues with spawning habitat, poor water conditions during critical incubation periods, or excessive predation on juvenile fish. For instance, significant water level fluctuations on a reservoir like Lake Oahe during the spring can expose walleye spawning beds, leading to poor egg survival. Understanding these fluctuations through survey data allows managers to identify patterns and, where possible, implement mitigation strategies or consider supplemental stocking programs. This metric is crucial because even if there are plenty of adult fish now, without consistent recruitment, the fishery will eventually decline. It's truly about securing the next generation of fish.
How South Dakota Biologists Conduct Surveys
You might be picturing someone with a fishing rod, but fish population surveys are much more scientific and controlled. Biologists employ a variety of specialized techniques designed to capture a representative sample of the fish community without causing undue harm.
Common Sampling Methods
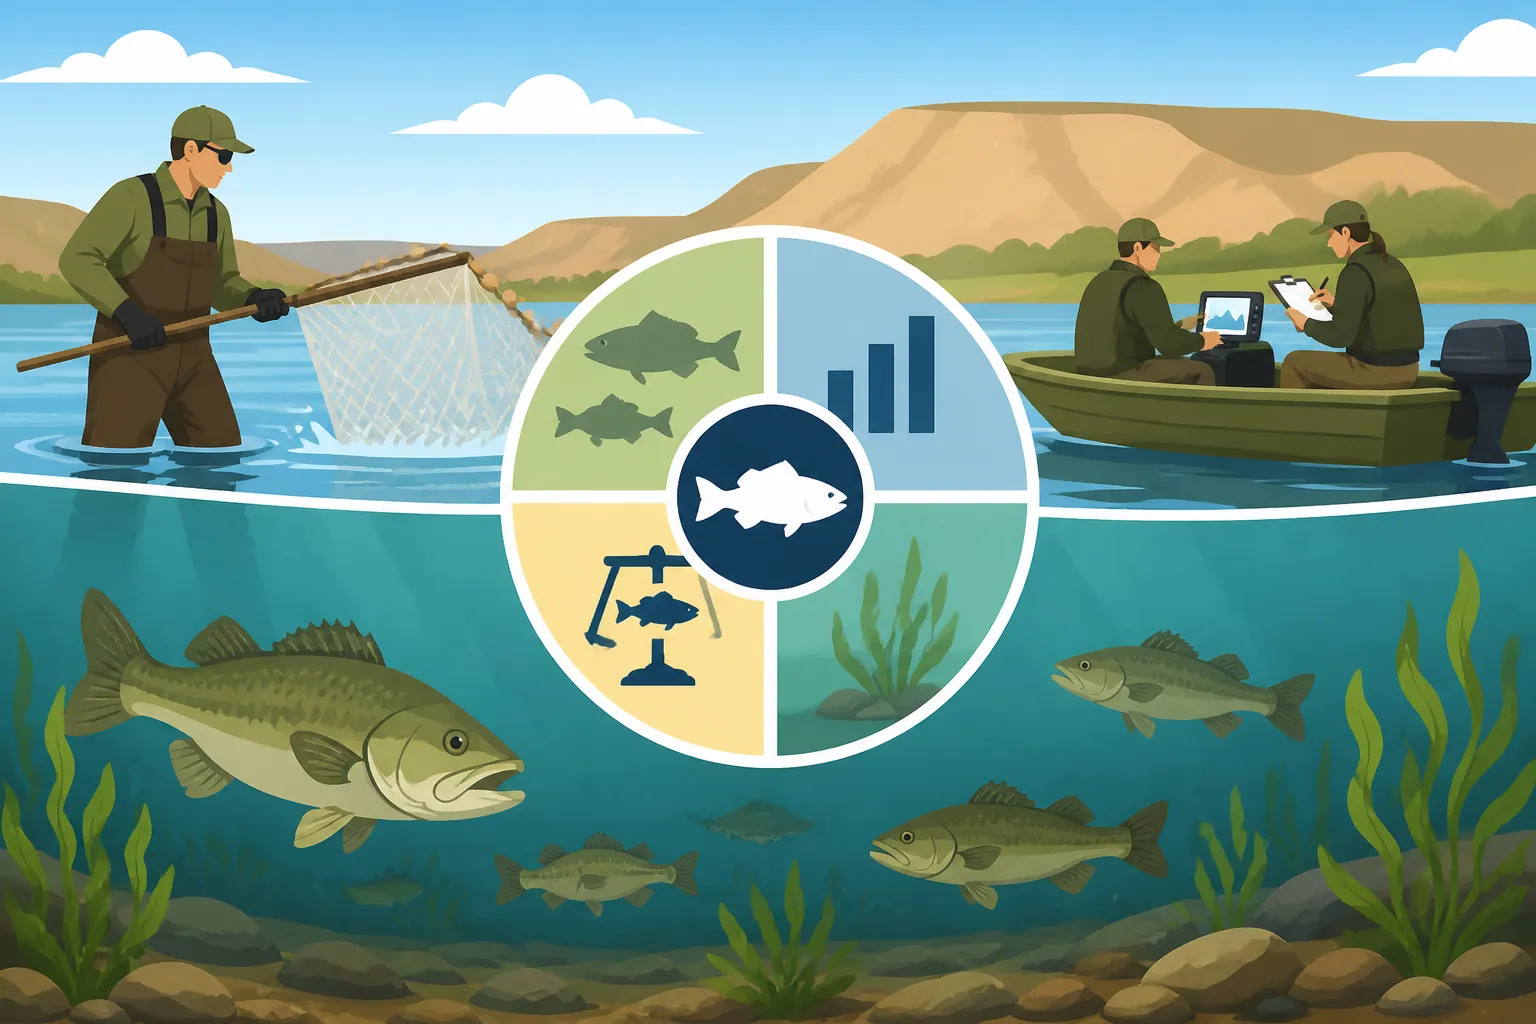
One of the most widely used methods is electroshocking, particularly effective for many species, including South Dakota largemouth bass and panfish, often used in shallower waters or along shorelines. A specialized boat sends an electrical current into the water, temporarily stunning the fish. The fish float to the surface, where biologists quickly net them, measure, weigh, and sometimes mark them before releasing them unharmed. This method is incredibly efficient for surveying specific areas and provides excellent data on species composition and relative abundance in those habitats. It allows biologists to gather a snapshot of the fish community in real-time, focusing on different habitat types like weed beds, rocky points, or submerged timber.
Another common method, especially for larger lakes and reservoirs like the Missouri River system, is gill netting. These nets are typically set for a specific period, usually overnight, and are designed to entangle fish that swim into them. Different mesh sizes are used to target a range of fish sizes and species, from smaller perch and crappie to larger walleye and northern pike. While gill netting is a valuable tool for assessing deeper water fish populations and providing data on larger, more mature fish, it does have the drawback of being less selective and can sometimes cause stress or injury to fish. However, experienced crews work diligently to minimize these impacts, processing and releasing fish as quickly and safely as possible. For specific species, like crappie and other panfish in shallower or vegetated areas, trap netting might be employed. These nets have a lead that guides fish into a series of chambers, effectively "trapping" them for collection and measurement. Each method has its strengths and is chosen based on the target species, water body characteristics, and the specific goals of the survey.
The Role of Technology and Citizen Science
Modern fish population surveys aren't just about nets and electricity; they heavily rely on advanced technology. Biologists use sophisticated GPS units to precisely map their sampling locations, ensuring consistency and accuracy across different survey efforts. High-resolution sonar and fish finders, similar to the ones many anglers have on their boats (some even available on Amazon), are used to identify underwater structures, locate schools of baitfish, and even estimate fish biomass before deploying sampling gear. Data logging equipment allows for immediate and accurate recording of fish measurements, environmental conditions, and sampling effort, streamlining the process and reducing potential errors. This integration of technology ensures that the data collected is as precise and comprehensive as possible, allowing for more robust analysis and informed management decisions.
Beyond the scientific surveys, citizen science also plays a valuable, though often less formal, role. Anglers themselves can contribute immensely through voluntary angler diaries or participation in creel surveys, where GFP staff interview anglers at boat ramps or access points. While not as controlled as scientific surveys, the cumulative data from thousands of angler hours on the water can provide valuable insights into catch rates, preferred lures, and even perceived changes in fish populations. For example, if a significant number of anglers consistently report catching fewer South Dakota walleye in a particular area, it can prompt biologists to focus their next survey efforts there. Your observations and honest reporting, even when you’re just chatting with a conservation officer, can contribute to the larger picture of fish health in our state.
Interpreting Survey Data for Better Fishing
All this scientific data might seem abstract, but it has very real, practical implications for you, the angler. Understanding how to interpret survey reports can actually make you a more successful and informed participant in South Dakota's fishing scene.
How Anglers Can Use Survey Reports
The GFP typically publishes summaries of their annual surveys, often available on their website or in their annual fishing handbooks. These reports are a goldmine of information. By delving into them, you can identify lakes that consistently show strong numbers of your target species. For instance, if you're chasing perch, a report showing a high CPUE for yellow perch and a good distribution of larger sizes might lead you to Bitter Lake Fishing Guide or another glacial lake that performed well. Likewise, if you're looking for bigger fish, pay attention to the length-frequency data. A lake with a healthy population of older, larger fish is a better bet for landing that trophy than one dominated by smaller, younger fish.
Survey reports can also help you understand population trends. Is the walleye population in Lake Francis Case on an upward swing, or has it been declining over the past few years? Knowing this can help set your expectations and even influence your fishing strategy. If numbers are high, you might focus on finding active schools. If numbers are lower, you might concentrate on prime feeding times or specific structures. These reports are a tool, much like a good fishing map or a reliable fish finder (which, by the way, you can often find great deals on, like this one I saw on Amazon recently). They give you an advantage by telling you what’s really going on with the fish. Furthermore, if you're preparing for an outing, checking the latest survey for South Dakota Fishing Season Dates and Limits is crucial, as these can change based on the very data we're discussing.
The Dynamic Nature of Fish Populations
It’s important to remember that fish populations are incredibly dynamic; they are rarely static year after year. A fish population is a living, breathing entity that constantly fluctuates. A severe winter with heavy snow and ice, followed by a rapid spring melt causing high, muddy water, could negatively impact a year's spawn for river fish like Missouri River Catfish Fishing Spots. Conversely, a string of mild winters and stable water levels might lead to several years of exceptional recruitment, creating a "boom" in a particular fish population a few years down the line.
External factors like prolonged droughts, severe floods, or even the introduction of invasive species can dramatically alter the dynamics of an entire ecosystem. For instance, the presence of invasive zebra mussels can clear water, changing light penetration and potentially impacting the forage base for some species. All of these elements mean that one year's survey report, while valuable, is just one snapshot in time. Smart anglers understand that fishing success isn't just about skill; it's also about adapting to these natural fluctuations. By staying informed through survey data, you can better adjust your techniques and expectations, ensuring you're always fishing smart, not just hard.
Summary of Key Survey Metrics
To give you a clearer picture, here's a quick rundown of some of the key things South Dakota fish population surveys measure and what they mean for you:
| Metric Measured | What It Reveals | Angler Implication |
|---|---|---|
| Species Composition | What fish species are present in the water body. | Identifies primary target species; indicates overall ecosystem health. |
| Relative Abundance (CPUE) | How many fish of each species are caught per unit of effort. | Indicates how "numerous" a species is; higher CPUE means more fish. |
| Length-Frequency Distribution | The range of fish sizes present in the population. | Shows potential for trophy fish; helps understand size restrictions like slot limits. |
| Growth Rates | How quickly fish are growing in length and weight. | Faster growth can mean bigger fish; indicates food availability and health. |
| Age Distribution | The age structure of the population (young, middle-aged, old). | Reveals strong year classes; indicates reproductive success and longevity. |
| Recruitment (Young-of-Year) | The presence and abundance of recently hatched fish. | Predicts future fishing success; indicates successful spawning. |
| Condition Factors | A measure of how "fat" or "skinny" fish are for their length. | Healthy, robust fish indicate good food sources; poor condition can signal issues. |
Understanding these measurements helps you move beyond just "luck" and start making more informed decisions on the water. It connects you to the bigger picture of how our precious South Dakota Fish Species are managed and protected.
Disclaimer
This article is for general informational purposes only and does not constitute professional advice. Laws, prices and regulations vary by location and change over time. Consult a qualified professional for guidance on your specific situation.